Any of our clients will know we talk about tracking issues A LOT. It’s the number one nightmare plaguing the advertising industry at the moment, and there are certainly no expectations that things are going to go back to the way they were.
What’s happened? What’s it got to do with iOS 14.5?
If you didn’t already know, Apple introduced a pop-up with the iOS 14.5 update (and equivalent features on Android) that allows users to ‘opt-out’ of cross-app tracking. Facebook summarises it here for their platform, but essentially no longer can Facebook, or other platforms, follow a user’s journey as they move out of the Facebook app and into their web browser.
The problem comes in two parts.
1. The first issue is no longer can an advertiser be certain that a user who clicked their ad completed a conversion or purchase once they leave Facebook/Instagram/TikTok/LinkedIn etc in the same session.
2. The second part of the problem is that these social media platforms can no longer know if someone who was shown an advert in their social media feed, but did not click anything on the ad, was still driven to search for the advertiser online at a later point. They are not able to perform cross-domain tracking on anyone who opted out of it.
What can advertisers do about the FIRST problem?
The solution to the first problem is not new, but it’s something most advertisers have never had to use as the Facebook Pixel used to work really well. That is of course, UTMs.
We’ve already discussed UTMs (Urchin Tracking Modules if you want to be tech-y) before, but briefly this is a little bit of code appended to your existing URL that feeds information into Google Analytics (GA) about where a user who clicked the link in an ad came from (visible in the ‘Referral’ section under source/medium, campaign, and ad content. You can create these manually using Google’s own tool, or automate them with a free or paid option like EasyAutoTagging, or follow a set-up tutorial like this one from Glew.
With a UTM, information like the name of your ad campaign, the ad set name, and the individual ad name associated with a user who enters your site from a marketing channel is pulled into your GA reports. This can include info about any custom goals or events they complete which you have set up in Google Analytics or Google Tag Manager.
There are however, pros and cons associated with using UTMs.
Pros:
- Link sessions to specific ads to see which campaigns are driving the most traffic to your site.
- Monitor conversions that happen within a single session from a click-through (leads generated / e-commerce events).
- Generated reports within GA based on users that came from social media adverts.
- No estimation occurs for purchases or conversions as the UTM accurately follows a user’s journey (so you can trust the accuracy of Google’s numbers).
Cons:
- For the UTM to track an entire session, the user must not click off the website’s domain (perhaps to go to a payment processor like Paypal, Klarna etc. or those will appear as the session referral rather than your ad.
- You can exclude any unwanted domain locations as referral sources in GA by going to admin> tracking info> referral exclusion list
- UTMs are single-session only, if a user enters your site from an ad but comes back at a later date by looking you up organically or going directly to your URL, the session will show as ‘organic’ or ‘direct’ and will not be attributed to your ads (and neither will any conversions that happen during these later sessions).
- In some cases, GA may show you the acquisition source of a conversion, which is how a user first came to your website regardless of if they made a purchase or filled in a form during a later session that didn’t come from an ad, but this relies on them using the same device on all sessions, and that they haven’t cleared their browser history or enabled any session tracking blockers.
- In some cases, GA may show you the acquisition source of a conversion, which is how a user first came to your website regardless of if they made a purchase or filled in a form during a later session that didn’t come from an ad, but this relies on them using the same device on all sessions, and that they haven’t cleared their browser history or enabled any session tracking blockers.
- UTMs rely on a user actually clicking a link on an ad in order to work. They won’t give you any data on conversions that occur when a user is shown an ad but then separately searches for your website, perhaps on another device or in their web browser.
What can advertisers do about the SECOND problem?
The second problem, tracking users who don’t click you ads but are still influenced by them to convert, cannot be solved by UTMs. In fact, there isn’t really a solution to this problem at all, certainly not one that will give you 100% accurate data.
If you run an e-commerce website (though all of this also applies to lead generation) and use Google Analytics to monitor your stats, you probably see that google / organic and (direct) / (none) are the largest referral sources in terms of revenue. If you run paid search ads, maybe google / cpc is also high on the list.
In order to understand why that is the case we have to understand a customers journey.
The following flow-chart explains why your ads may be performing better than what is shown in your Google Analytics reports:
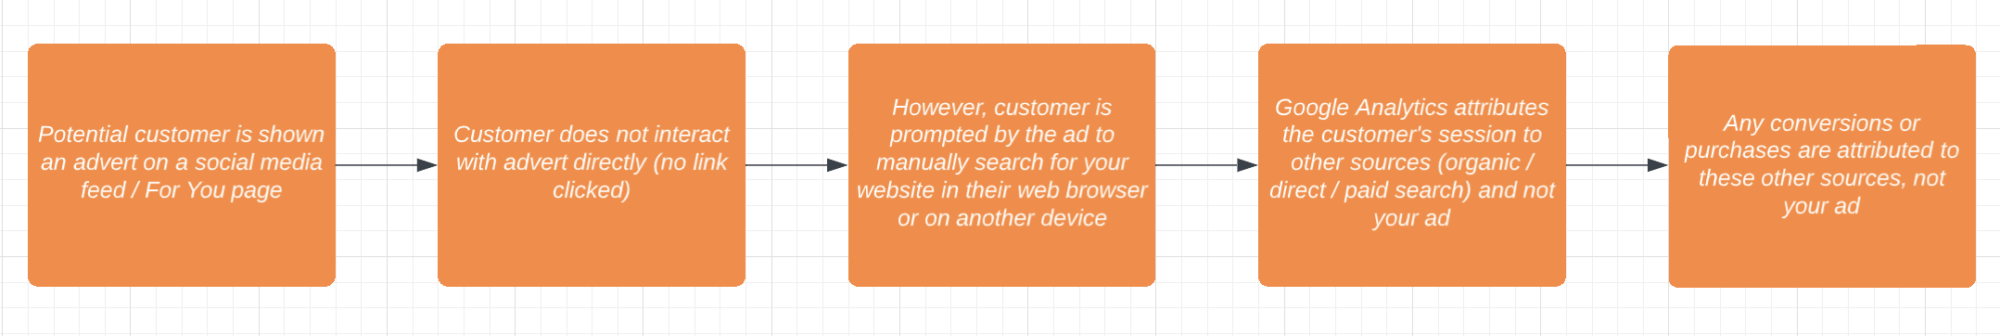
As a Google product, analytics also tends to favour paid search over other traffic sources, and quite often organic searches will result in a ‘paid search’ click because the paid ad will appear at the top of search results. Google also charges advertisers ‘per-click’ so it’s in their interest to drive as many clicks through that and attribute more conversions to it.
(direct) / (none) as a referral source may also seem quite misleading, but many web browsers now autofill your url instead of taking a user to a search results page, which can appear as though they directly typed in your web address in GA.
The (imperfect) solution:
We can calculate the estimated performance of our ads beyond what Google tells straight away. This won’t be a perfect solution, and it certainly works better in some situations that others, but its one method that may solve your tracking issues.
To begin with, you need to first calculate a Revenue Per User (RPV) for both your organic traffic and direct traffic during a period of time when you ran no advertising campaigns. For new websites this may be easy, but for well established companies it might be quite difficult.
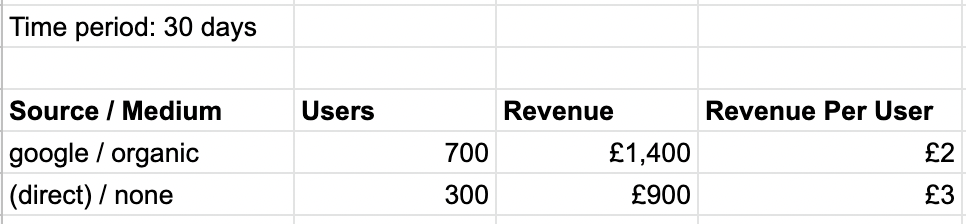
Say you that you average 1000 users in a 30 day period of no ads running: 700 from organic search and 300 from direct (the longer the period of time you can find the better, but as little as 7 days will still work).
Over that time GA says that those 700 organic search users gave you a revenue of £1400, that means organic search had a revenue per user (RPV) of £2.
Likewise, direct traffic gave you a revenue of £900 in GA, which means your revenue per user there is £3.
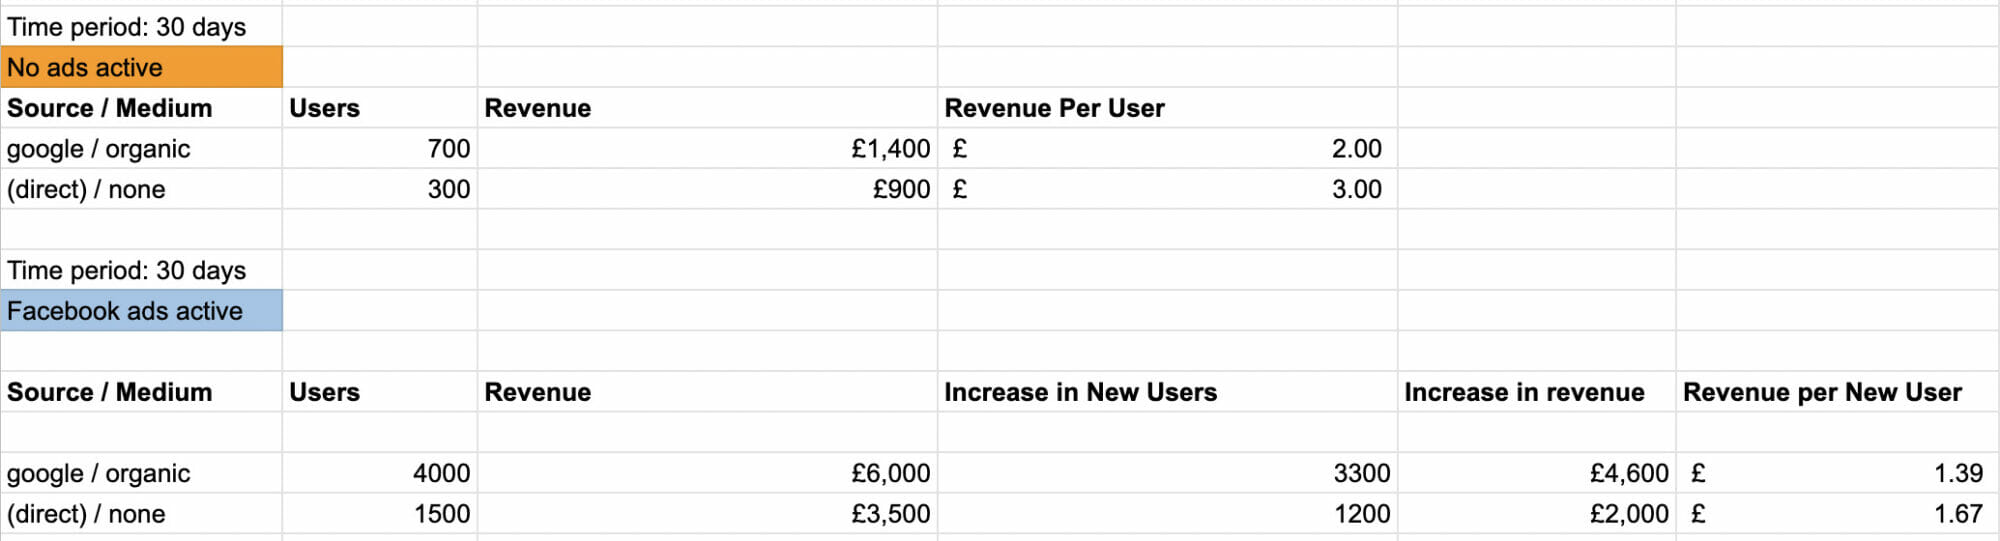
Now imagine you’ve had your ads running for 30 days and your new user counts are 4000 from organic search, and 1500 from direct sessions. As long as you’re not running multiple ads on different platforms (Google paid search is fine as GA will accurately give you results from that separate to these referral sources) then we could safely estimate that the increase users was caused by your ads on a platform like Facebook.
Next we take away our base revenue per user to estimate exactly how much money our Facebook ads are generating for us outside of the sessions we can track with UTMs.
The reason we work out an average revenue per user is because you need to know if your ads are doing well or not.
While your base average RPV shouldn’t fluctuate much unless some other factor encourages traffic to you site (like a really good organic social post blowing up), the RPV associated with your ads will fluctuate based on their performance.
Think about it in terms of percentages. In the previous example, for google / organic: 82.5% of traffic since ads were turned on is new traffic, while 17.5% is existing organic.
That 17.5% has a RPV of £2, unchanging, so if 17.5% of your total users goes up or down, that percentage group will always make you £2 per user, and the rest of the revenue you made is then caused by your ads.
Say you have a revenue of £2500 attributed to 2000 users, then 350 users (17.5% of the 2000) made you £700 (£2 per user) while the remaining 82.5% (1650 users) created £1800 of revenue (or a £1.09 RPV). Repeat this process for direct traffic.
Finally, combine this RPV with the RPV of anything you CAN track coming from your ads with your UTMs, and you will have your overall average Revenue Per User for your ads. The greater the RPV for the portion of users we estimate are driven by your ads, the better the ads are performing.